My Projects
As a professional with years of experience studying air pollutants, I've had the opportunity to work on many interesting projects. Here are a few highlights:
Improving land-surface energy flux and boundary layer mixing modeling with land-surface remote sensing
My Role: Co-Principal Investigator
Land-surface energy dynamics and boundary layer mixing are pivotal to the fidelity of meteorology prediction and air quality modeling. Yet their accurate representation in the current generation of regional weather models remains a challenge due to the complexity of the land surface and limited observational constraints. Here, we integrate comprehensive satellite-based land-surface measurements into a state-of-the-art regional weather forecast model—NASA Unified Weather Research and Forecast model coupled with the NASA Land Information System (Nu-WRF/LIS). Leveraging real-time assimilation of high-resolution satellite measurements of land cover, greenness, leaf area index, and soil moisture datasets, we notably improve model performance in surface energy fluxes (i.e., sensible and latent heat fluxes) and atmospheric boundary layer mixing across four seasons over various land covers in the western U.S. (e.g., arid areas, forests, grassland, and croplands). The improvements are most prominent over irrigated croplands and grasslands, where the assimilation of land-surface remote sensing in Nu-WRF/LIS reduces the model biases in annual surface energy fluxes by 50% to 200%. Model biases in atmospheric boundary layer height are reduced by ~60 m on an annual average basis. These improvements to numerical weather reanalyses strengthen the scientific foundation for the formulation of state-level air quality implementation strategies and offer a precise basis for shaping emission regulatory policies.
Nu-WRF coupled with LIS
WRFv4.4
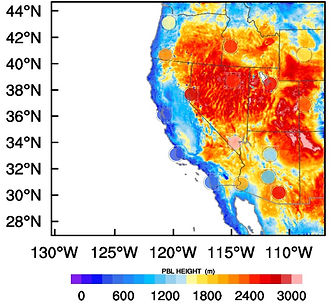
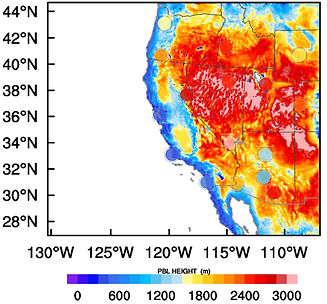
This figure, derived from the first-ever coupled NuWRF/LIS (NASA Unified WRF and Land Information System) simulation using satellite data assimilation that I conducted, shows the reduction in summer-time average ABL depth in the central valley of California in NuWRF/LIS compared to regular WRF simulation. The colorful dots are observed ABL depth derived from rawinsonde data. The shallow ABL is likely to be caused by the relatively small summer, daytime sensible heat fluxes in the valley due to irrigation. Information about "real-time" soil moisture and irrigation normally is not available in standard numerical weather modeling systems (e.g. WRF).
This project is funded by the NASA Health and Air Quality program and will go through 2022 to 2025. The team at Penn State (collaborating with CARB and PA DEP) is thrilled to keep sharing our project outcomes here. Our research initiative focuses predominantly on improving air pollution modeling and understanding the impact on public health, starting from ambient air quality to specific health outcomes. We believe that our findings will lead to breakthroughs in environmental health research. Keep a lookout for our upcoming results and insights.
CO2 weather and surface fluxes in multi-season aircraft measurements and multi-model ensemble in North America
My Role: Lead Researcher
The ability of current global models to simulate the transport of CO2 by mid-latitude, synoptic-scale weather systems (i.e., CO2 weather) is important for inverse estimates of regional and global carbon budgets but remains unclear without comparisons to targeted measurements. Here, we evaluate ten models that participated in the Orbiting Carbon Observatory-2 model intercomparison project (OCO-2 MIP v9) with intensive aircraft measurements collected from the Atmospheric Carbon Transport (ACT)-America mission.

We quantify model-data differences in the spatial variability of CO2 mole fractions, mean winds, and boundary layer depths in 27 mid-latitude cyclones spanning four seasons over the central and eastern United States. We find that the OCO-2 MIP models are able to simulate observed CO2 frontal differences with varying degrees of success in summer and spring, and most underestimate frontal differences in winter and autumn. The models may underestimate the observed boundary layer-to-free troposphere CO2 differences in spring and autumn due to model errors in boundary layer height. The attribution of the causes of model biases in other seasons remains elusive. Transport errors, prior fluxes, and/or inversion algorithms appear to be the primary cause of these biases since model performance is not highly sensitive to the CO2 data used in the inversion. The metrics presented here provide new benchmarks regarding the ability of atmospheric inversion systems to reproduce the CO2 structure of mid-latitude weather systems. Controlled experiments are needed to link these metrics more directly to the accuracy of regional or global flux estimates.

Further reading: 1. https://doi.org/10.1029/2021JD035457; 2. https://doi.org/10.1029/2022GL100147
Investigating extreme ozone pollution in the western U.S. using intensive field measurements and chemical models
My Role: Lead Researcher
In this project, I leveraged intensive field measurements from the Fires, Asian, and Stratospheric Transport-Las Vegas Ozone Study (FAST-LVOS), alongside high-resolution simulations with two global models (GFDL-AM4 and GEOS-Chem), to study the sources of O3 during high-O3 events. My findings helped to shed light on the sources of ozone pollution and inform efforts to improve air quality in this region.

FAST-LVOS campaign
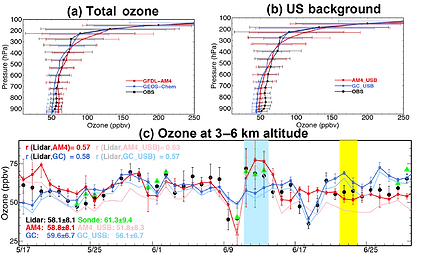
This figure shows the mean vertical O3 profiles at Joe Neal as observed with ozonesondes (black; 30 launches) and simulated with GFDL-AM4 (red) and GEOS-Chem (blue) during FAST-LVOS (May–June 2017). Horizontal bars represent the standard deviations across daily profiles; (b) Same as (a) but showing US background (USB) O3 estimated by the two models. (c) Time series of O3 averaged over 3–6 km altitude above NLVA during FAST-LVOS as observed (black: lidar; green: ozonesonde) and simulated with GFDL-AM4 (thick red line) and GEOSChem (thick dark blue line), together with simulated USB O3 (light lines). Here and in other figures, AM4_USB represents USB estimated by GFDL-AM4 and GC_USB represents USB estimated by GEOS-Chem. The blue shading highlights the period with stratospheric intrusions and the yellow shading, the wildfire event. Vertical bars represent the standard deviations across hourly averages.
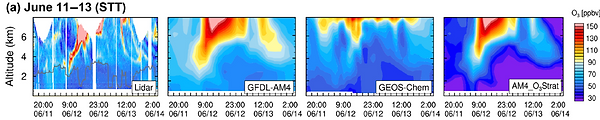
This figure shows the time–height curtain plots of ozone above the North Las Vagas airport as observed with TOPAZ lidar and simulated with GFDL-AM4 and GEOS-Chem during one stratospheric ozone intrusion event. The last panel shows the stratospheric ozone tracer estimated with GFDL-AM4. Measurements clearly show that stratospheric ozone intruded into the lower troposphere and was further mixed down by a deep atmospheric boundary layer (the boundary layer height was derived from TOPAZ lidar measurements and is shown as the gray line in the first panel). Both GFDL-AM4 and GEOS-Chem capture the timing of intrusion, but GFDL-AM4 better simulates the stratospheric intrusion ozone plume than GEOS-Chem.
Further reading: 1. https://doi.org/10.5194/acp-20-10379-2020; 2. https://doi.org/10.5194/acp-22-1707-2022
Leveraging field campaigns and chemical transport models to study the impacts of “new” reactive nitrogen species on ozone
My Role: Lead Researcher
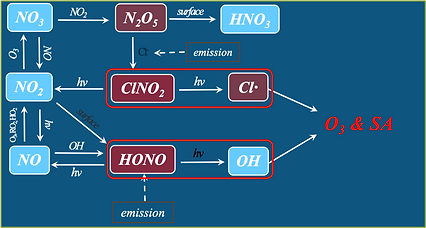
Nitrous acid (HONO) and nitryl chloride (ClNO2) – through their photolysis – can have profound effects on
the nitrogen cycle and oxidation capacity of the lower troposphere.

By default, WRF-Chem does not consider the direct sources and most of the secondary formation processes of nitrous acid, nor the chlorine chemistry. Thus, the impacts of these new sources/processes of reactive nitrogen compounds on the chemistry of the lower part of the troposphere have not been addressed yet. In this study, I updated the WRF-Chem model with the currently known sources and chemistry of HONO and chlorine in a new chemical mechanism (I named it CBMZ_ReNOM), and I applied it to study the combined effects of HONO and ClNO2 on summertime O3 in the lower troposphere.
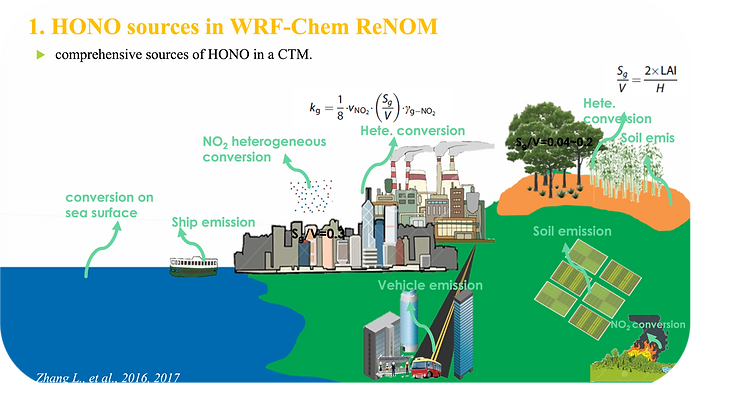
HONO can be emitted and formed via various pathwyas. In this project, we parameterized up-to-date HONO sources into regional chemical models. These sources included (1) heterogeneous reactions on ground surfaces with the photoenhanced effect on HONO production, (2) photoenhanced reactions on aerosol surfaces, (3) direct vehicle and vessel emissions, (4) potential conversion of NO2 at the ocean surface, and (5) emissions from soil bacteria.
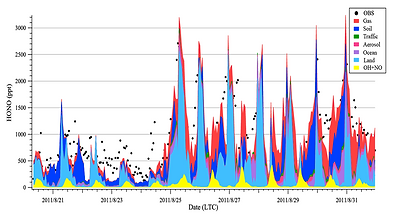
The WRF-Chem model by default underestimated these reactive nitrogen and halogen compounds by 1-3 orders. This new chemical module (i.e. ReNOM) I developed is able to capture observed HONO in various environments (even at a suburban site located within complex circumstances with artificial land covers, ocean, and forests in Hong Kong; see the figure on the right-hand side). It also reasonably simulates observed concentrations of ClNO2 and N2O5 in both northern and southern China.

The new module noticeably improves summertime ozone predictions at over 900 monitoring stations throughout China by reducing the mean bias from -4.3 to 0.1 ppb. It also improves the fidelity of PM2.5 simulations. The new module has been applied in various regions in China and some of the model developments have been adopted by research teams in Europe and U.S. Our studies suggest the importance of considering these reactive nitrogen and halogen species simultaneously in chemical transport models to better simulate the formation of ozone and PM2.5 in polluted regions.